

Alerts
Alerts Overview
Alerts are a critical component of the Monad security data pipeline that monitor your pipeline metrics and system health in real-time. They enable proactive monitoring by evaluating conditions against your pipeline's operational metrics and triggering notifications when specific thresholds or patterns are detected.
How Alerts Work
Alerts operate as monitoring components that evaluate your pipeline data and system state at regular intervals. The alert evaluation process follows a consistent pattern:
- Data Collection: Alerts collect the data they need to evaluate — pipeline metrics over a time window, current pipeline status, billing invoice totals, or real-time log events depending on the alert type
- Condition Evaluation: The alert evaluates the collected data against configured thresholds or conditions
- Alert Generation: When conditions are met, alerts are generated with contextual metadata
- Notification Delivery: Alerts can be configured as an input to send alerts to any configured output through a pipeline
Common Configuration Patterns
All alerts share similar configuration concepts:
Alert Rule Configuration
- Pipeline IDs: For pipeline-scoped alerts, specifies which pipelines to monitor. By default this is an include-list — only the listed pipelines are monitored — but it can be inverted into an exclude-list to monitor every pipeline except those listed. An empty list monitors all enabled pipelines in the organization either way. Disabled pipelines are never evaluated, even when listed; they return to scope when re-enabled. Billing alerts operate at the organization level and do not use this field.
- Severity: Defines the alert severity level (e.g., critical, high, medium, low, info)
- Rule Configuration: Alert-specific settings like thresholds, operators, and time windows
Evaluation Behavior
- Regular Evaluation: Alerts are evaluated at regular intervals (every 5 minutes)
- Scoped Alerting: Most alerts fire independently per pipeline; billing alerts fire at the organization level
- Contextual Metadata: Alerts include relevant context about what triggered them
Alert Structure
Alert Object Structure
Alerts generated by the system follow a consistent structure:
Code
Top-Level Fields
Every alert carries the same top-level envelope, regardless of type:
- id: Unique identifier for this alert instance, of the form
{rule_id}:{resource_type}:{resource_id}:{fired_at}. - rule_id: The ID of the alert rule that produced the alert.
- rule_type: The type of rule that fired — one of
schema-detection-alert,threshold-alert,error-rate-alert,pipeline-status-alert,volume-anomaly-alert,monad-log-alert, orbilling-metrics-cost-budget. Use this to branch on alert type when processing the payload. - name: The name of the alert rule.
- organization_id: The organization the alert belongs to.
- severity: One of
critical,high,medium,low, orinfo(see below). - description: A human-readable summary of what triggered the alert.
- metadata: Type-specific context — the fields vary by
rule_typeand are documented on each alert type's page. - resource: The resource the alert is scoped to (
resource_typeandresource_id). Pipeline-scoped alerts carry the pipeline here; organization-scoped alerts (e.g. billing) omitresourceentirely. - created_at / fired_at: Unix epoch seconds (integers) for when the alert instance was created and when it fired.
- status.state:
FIRINGwhen the condition is active, orRESOLVEDwhen it has cleared (see Deduplication and Resolution).
Severity Levels
Common severity levels across alerts:
"critical": Requires immediate attention"high": Important, needs attention within the hour"medium": Worth investigating, not an emergency"low": Low priority, no immediate action required"info": Informational alerts for awareness
Deduplication and Resolution
Alerts include built-in deduplication and automatic resolution to prevent alert fatigue:
- Deduplication: Once an alert fires for a given rule and resource, it will not re-fire for the same combination for at least one hour. This means your team won't be flooded with repeated notifications for an ongoing issue.
- Resolution: When the condition that triggered an alert stops being true, the system begins a clearing window. If the alert remains non-firing for 15 minutes, a
RESOLVEDevent is published automatically. - Resolution events are not shown in the UI — they are delivered exclusively through the Monad Alerts input, which streams both
FIRINGandRESOLVEDevents as structured JSON into your pipelines.
Best Practices
Configuration
- Set appropriate thresholds based on your pipeline's normal operating ranges
- Use meaningful alert names that clearly indicate what is being monitored
- Configure time windows that align with your monitoring needs
Alert Management
- Regularly review and tune alert thresholds to reduce noise
- Use appropriate severity levels to prioritize response
- Monitor alert frequency to identify systemic issues
Integration with Pipeline Components
Alerts work seamlessly with other Monad components:
- Pipelines: Monitor the health and performance of your data pipelines
- Metrics: Query real-time and historical metrics data
- Monad Alerts Input: Use the Monad Alerts input to ingest all alert triggers and resolutions into your pipelines, enabling you to route alerts to any destination of your choice through standard pipeline outputs
Creating Alert Rules via the API
Alert rules can be created programmatically with a POST to /v3/{organization_id}/alert_rules. This is the path used by the public API, the SDKs, and any automation — the UI configuration page issues the same request under the hood.
The request body has a small set of top-level fields plus a rule_config object that holds the type-specific configuration:
| Field | Type | Description |
|---|---|---|
name | string | Human-readable name for the rule. |
type | string | The alert type ID: threshold-alert, error-rate-alert, volume-anomaly-alert, pipeline-status-alert, monad-log-alert, or billing-metrics-cost-budget. |
severity | string | Severity level (critical, high, medium, low, or info). |
pipeline_ids | array of strings | Pipelines the rule monitors, interpreted as an include-list by default (see invert_selection). An empty array monitors all enabled pipelines in the organization; disabled pipelines are skipped. Omitted for organization-level alerts such as billing. |
invert_selection | boolean | When true, pipeline_ids is read as an exclude-list: the rule monitors every pipeline except those listed. Defaults to false. Only applies to pipeline-scoped alert types. |
active | boolean | Whether the rule is active on creation. |
rule_config | object | The type-specific configuration — see the wrapper note below. |
The rule_config wrapper
The type-specific settings documented on each alert type page — thresholds, operators, time windows, and so on — are nested under a settings key inside rule_config:
Code
A flat rule_config without the settings wrapper is rejected by validation. The field tables on each alert type page describe the values that go inside settings (the same fields the UI config page renders), and every page includes complete request bodies you can copy directly.
Scoping to pipelines
Pipeline-scoped alert types use pipeline_ids together with invert_selection to control which pipelines the rule monitors:
- Specific pipelines (default) — list them in
pipeline_idsand leaveinvert_selectionasfalse(or omit it). The rule monitors only those pipelines. - All pipelines except some — set
invert_selectiontotrue. The rule monitors every pipeline except those inpipeline_ids. - All pipelines — leave
pipeline_idsempty. An empty list means all enabled pipelines in the organization regardless ofinvert_selection.
Selections are stored as you set them: a pipeline stays in the list even while it is disabled, and returns to the rule's scope when it is re-enabled. Billing and other organization-scoped alert types ignore both fields.
Example — monitor every pipeline except two staging pipelines:
Code
Full example
Creating a Threshold Alert that fires when ingress exceeds 500 MB over 5 minutes:
Code
Managing Alerts in the UI
The Monad UI provides two main surfaces for working with alert rules: the Alert Rules list where you manage and monitor your rules, and the Alert Rule configuration page where you create and edit individual rules.
Alert Rules List
The Alert Rules list gives you a central view of every rule configured in your organization. From here you can see each rule's name, type, severity, the pipelines it covers, and whether it is currently active.
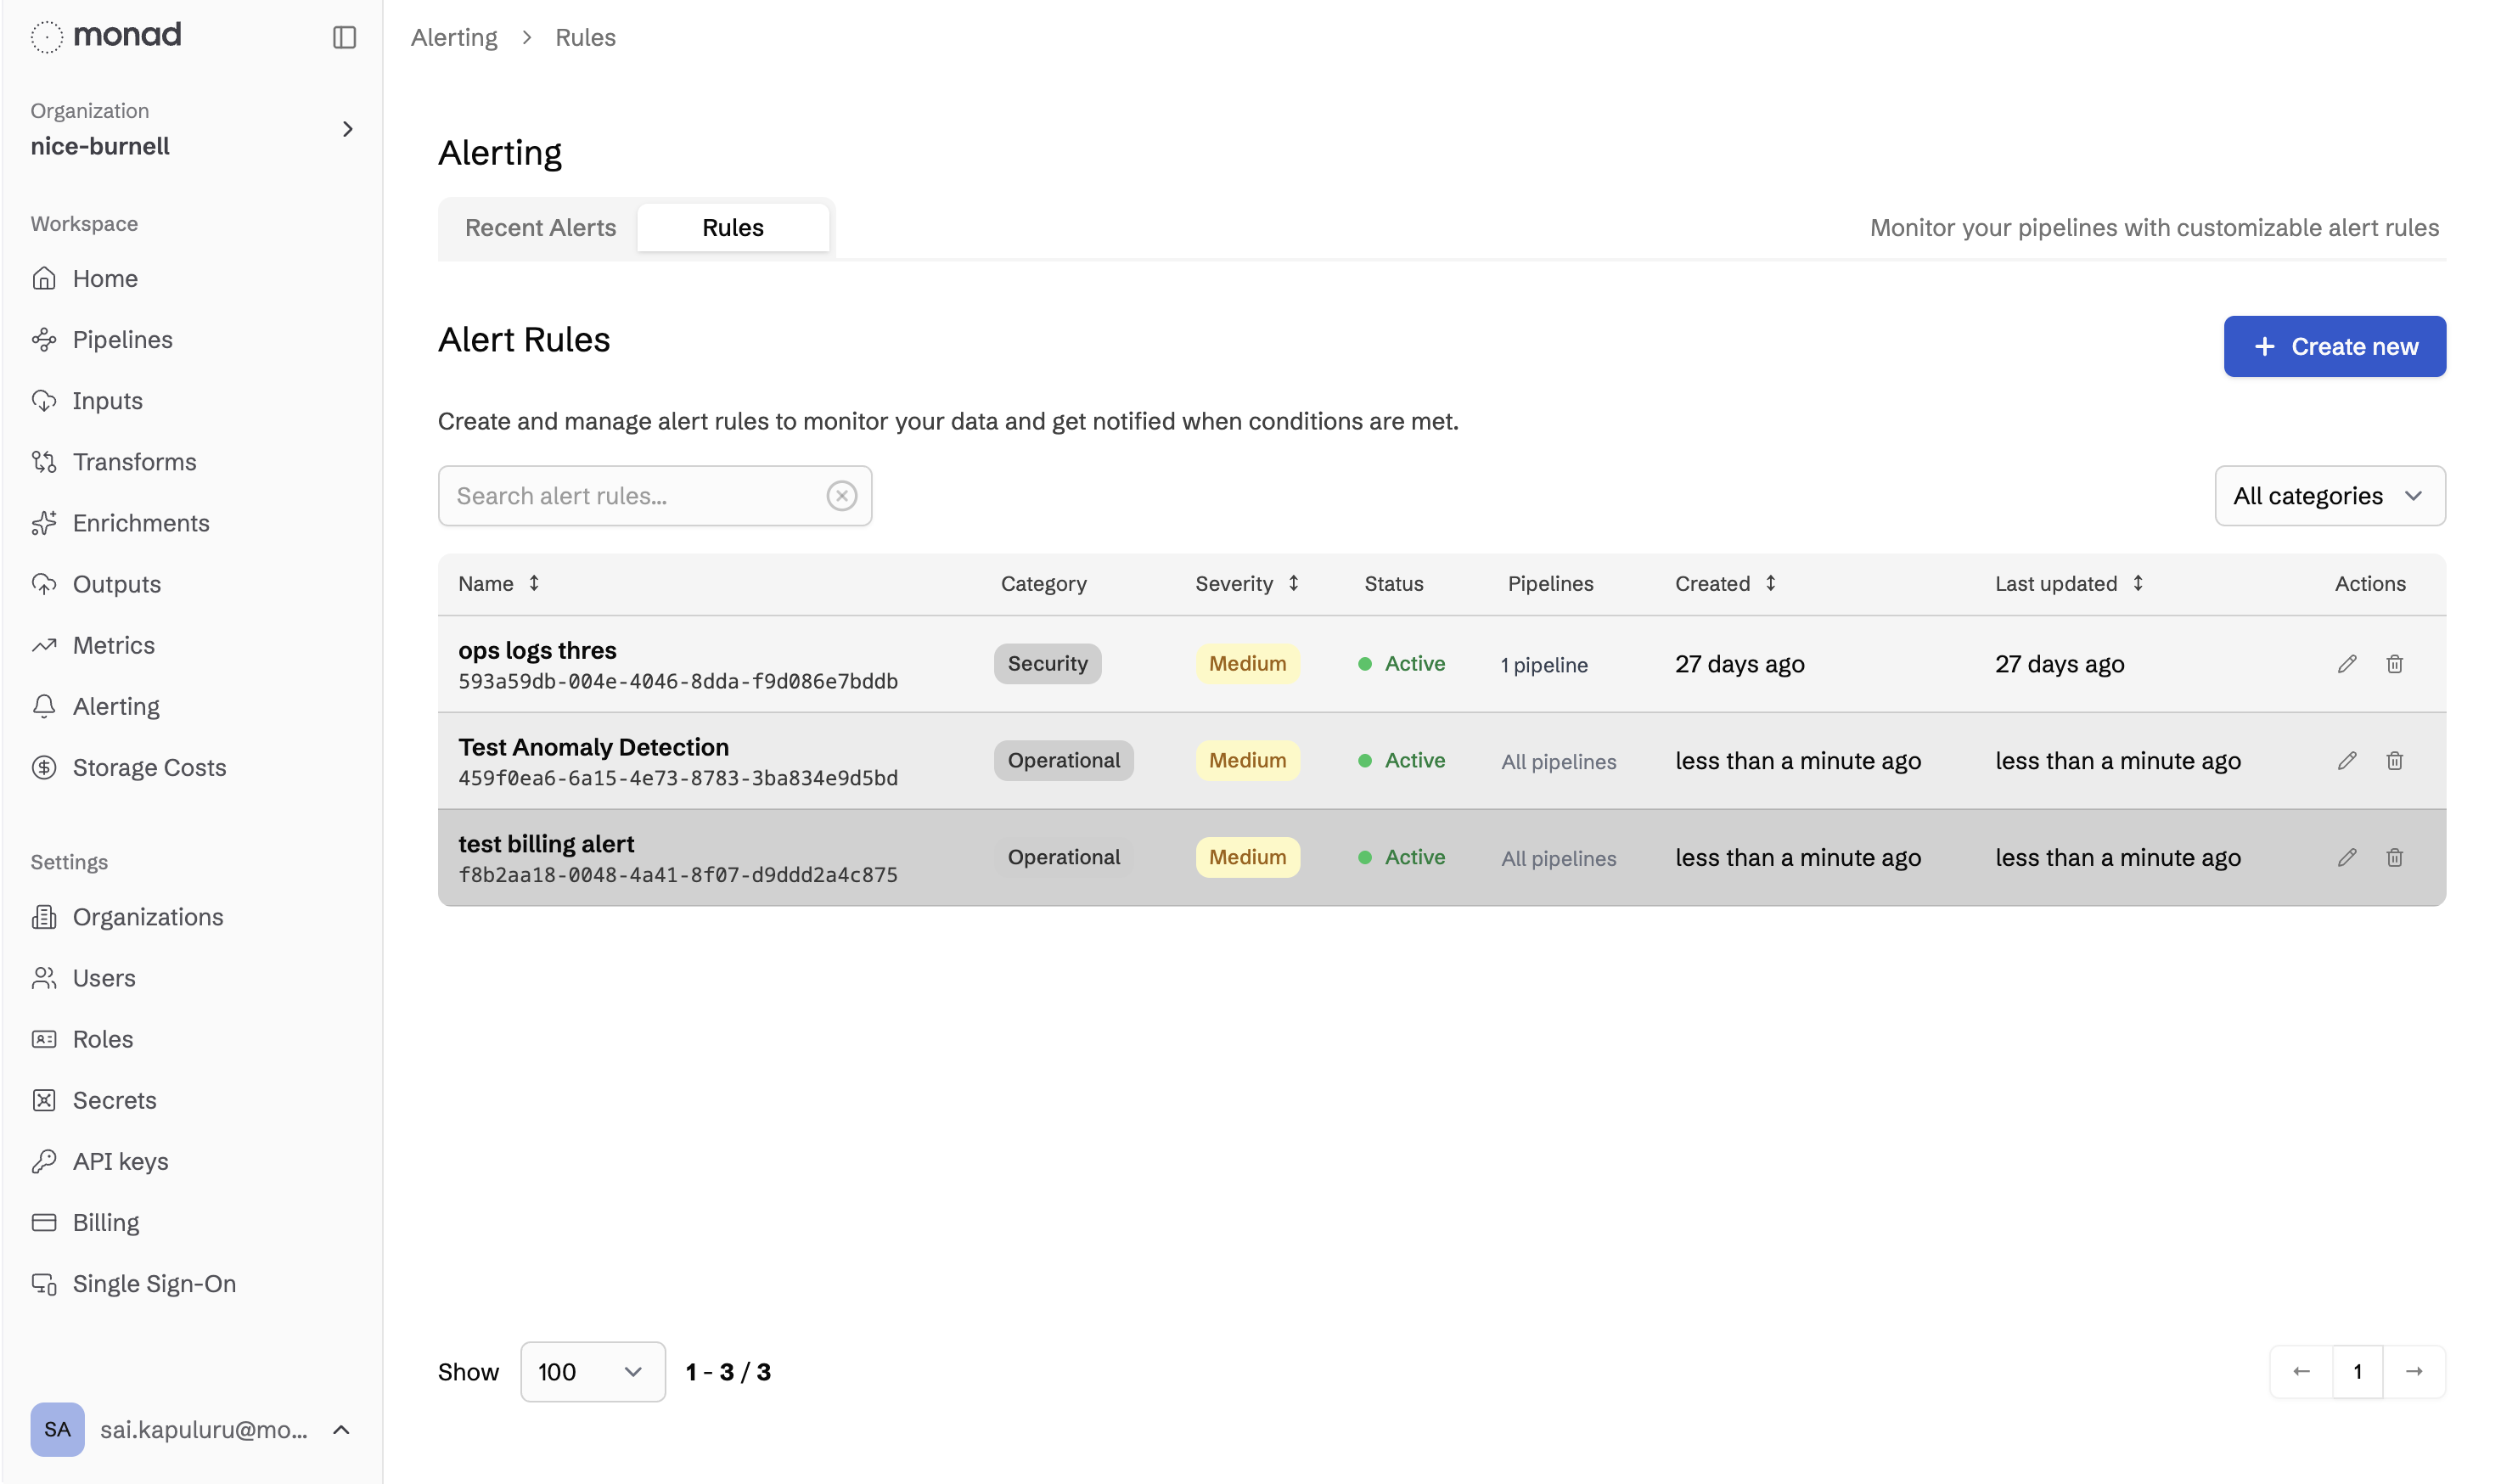
Key actions available from this page:
- Create a new rule using the New Alert Rule button in the top-right corner
- Edit or delete an existing rule from the row's action menu
- Filter and search rules by name or type to quickly locate a specific rule in large organizations
Alert Rule Configuration
Clicking Create New or selecting Edit on an existing rule opens the configuration page. This is where you define the alert type, the conditions that trigger it, and the pipelines it monitors.
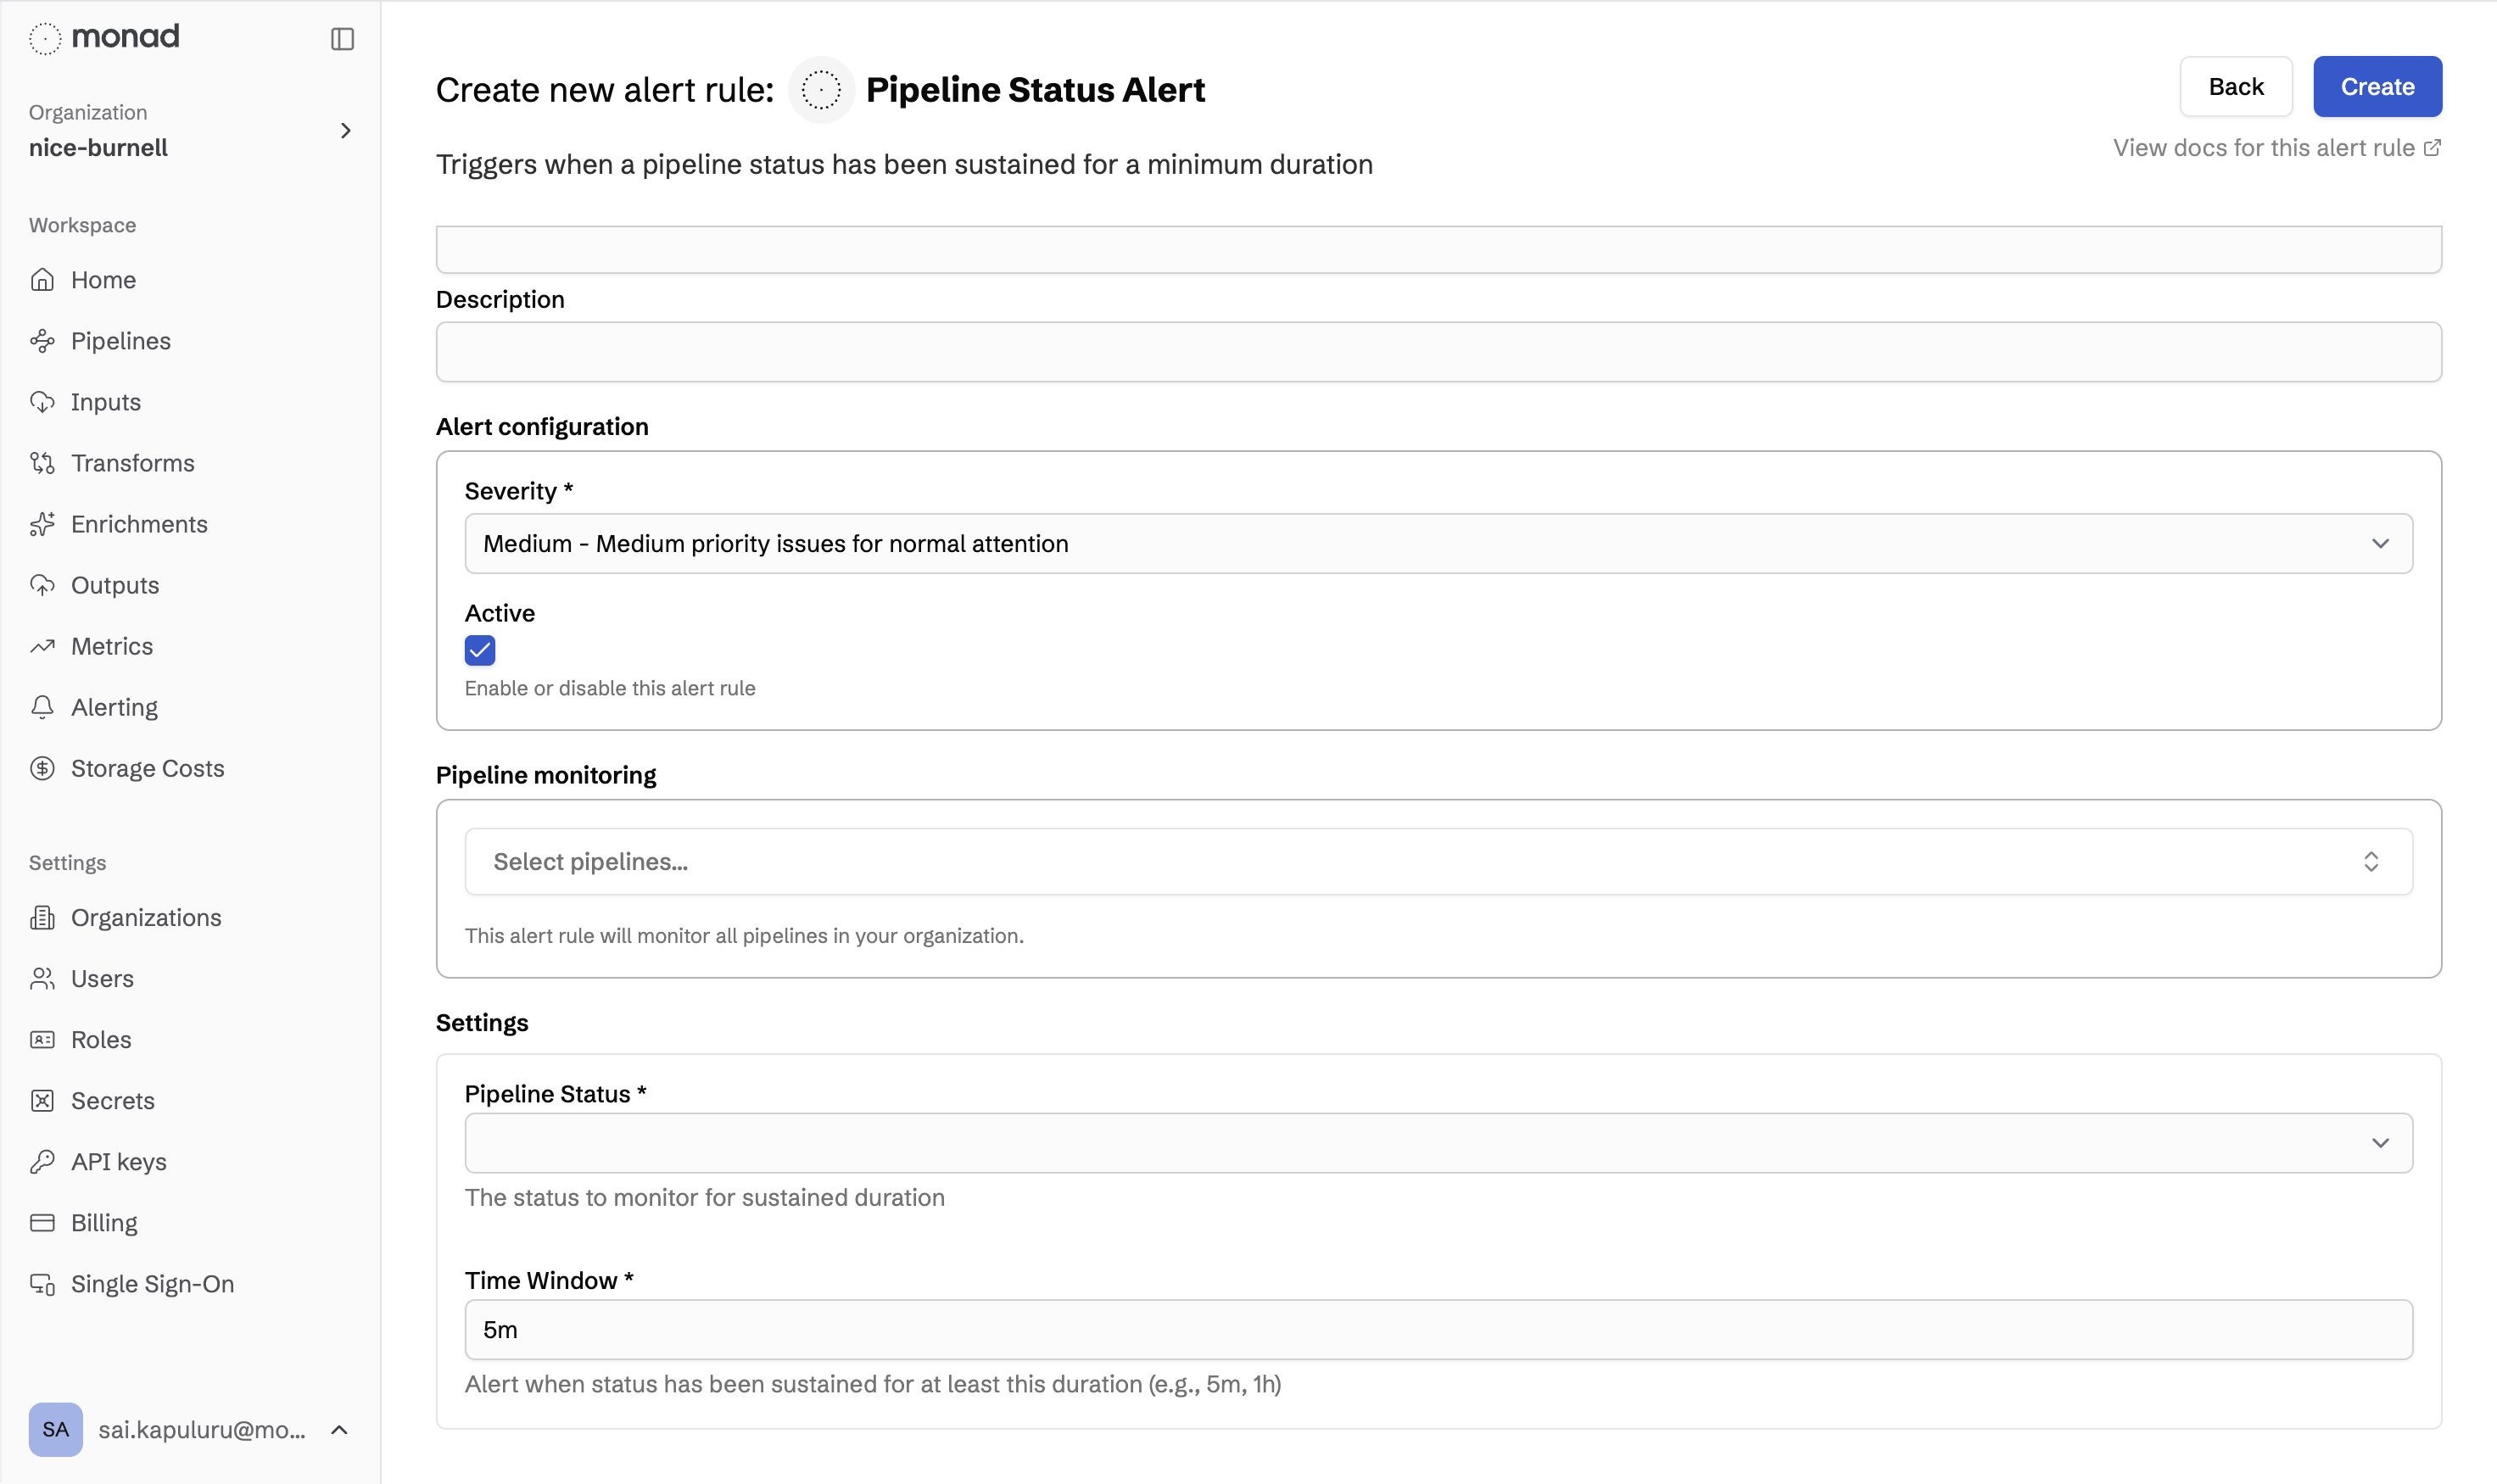
The configuration page is organized into three areas:
- Rule Details — Set a descriptive name and choose a severity level (
critical,high,medium,low, orinfo) that reflects how urgently the alert should be acted on. - Pipeline Scope — Choose which pipelines this rule monitors. Leaving the selection empty applies the rule to all enabled pipelines in your organization. Selecting specific pipelines limits the scope to only those pipelines.
- Rule Type & Conditions — Select the alert type (e.g., Threshold, Error Rate, Volume Anomaly, Pipeline Status, Organization Logs) and fill in the type-specific settings such as metric name, threshold value, operator, and time window. Each field is described in detail on the individual alert type pages.
After saving, the rule becomes active immediately and begins evaluating your pipelines on the next evaluation cycle.
Live Alert Event Stream
The alert event stream shows alerts firing in real time across all active rules. Each event displays the rule name, affected pipeline, severity, a human-readable description of what triggered the alert, and the timestamp.
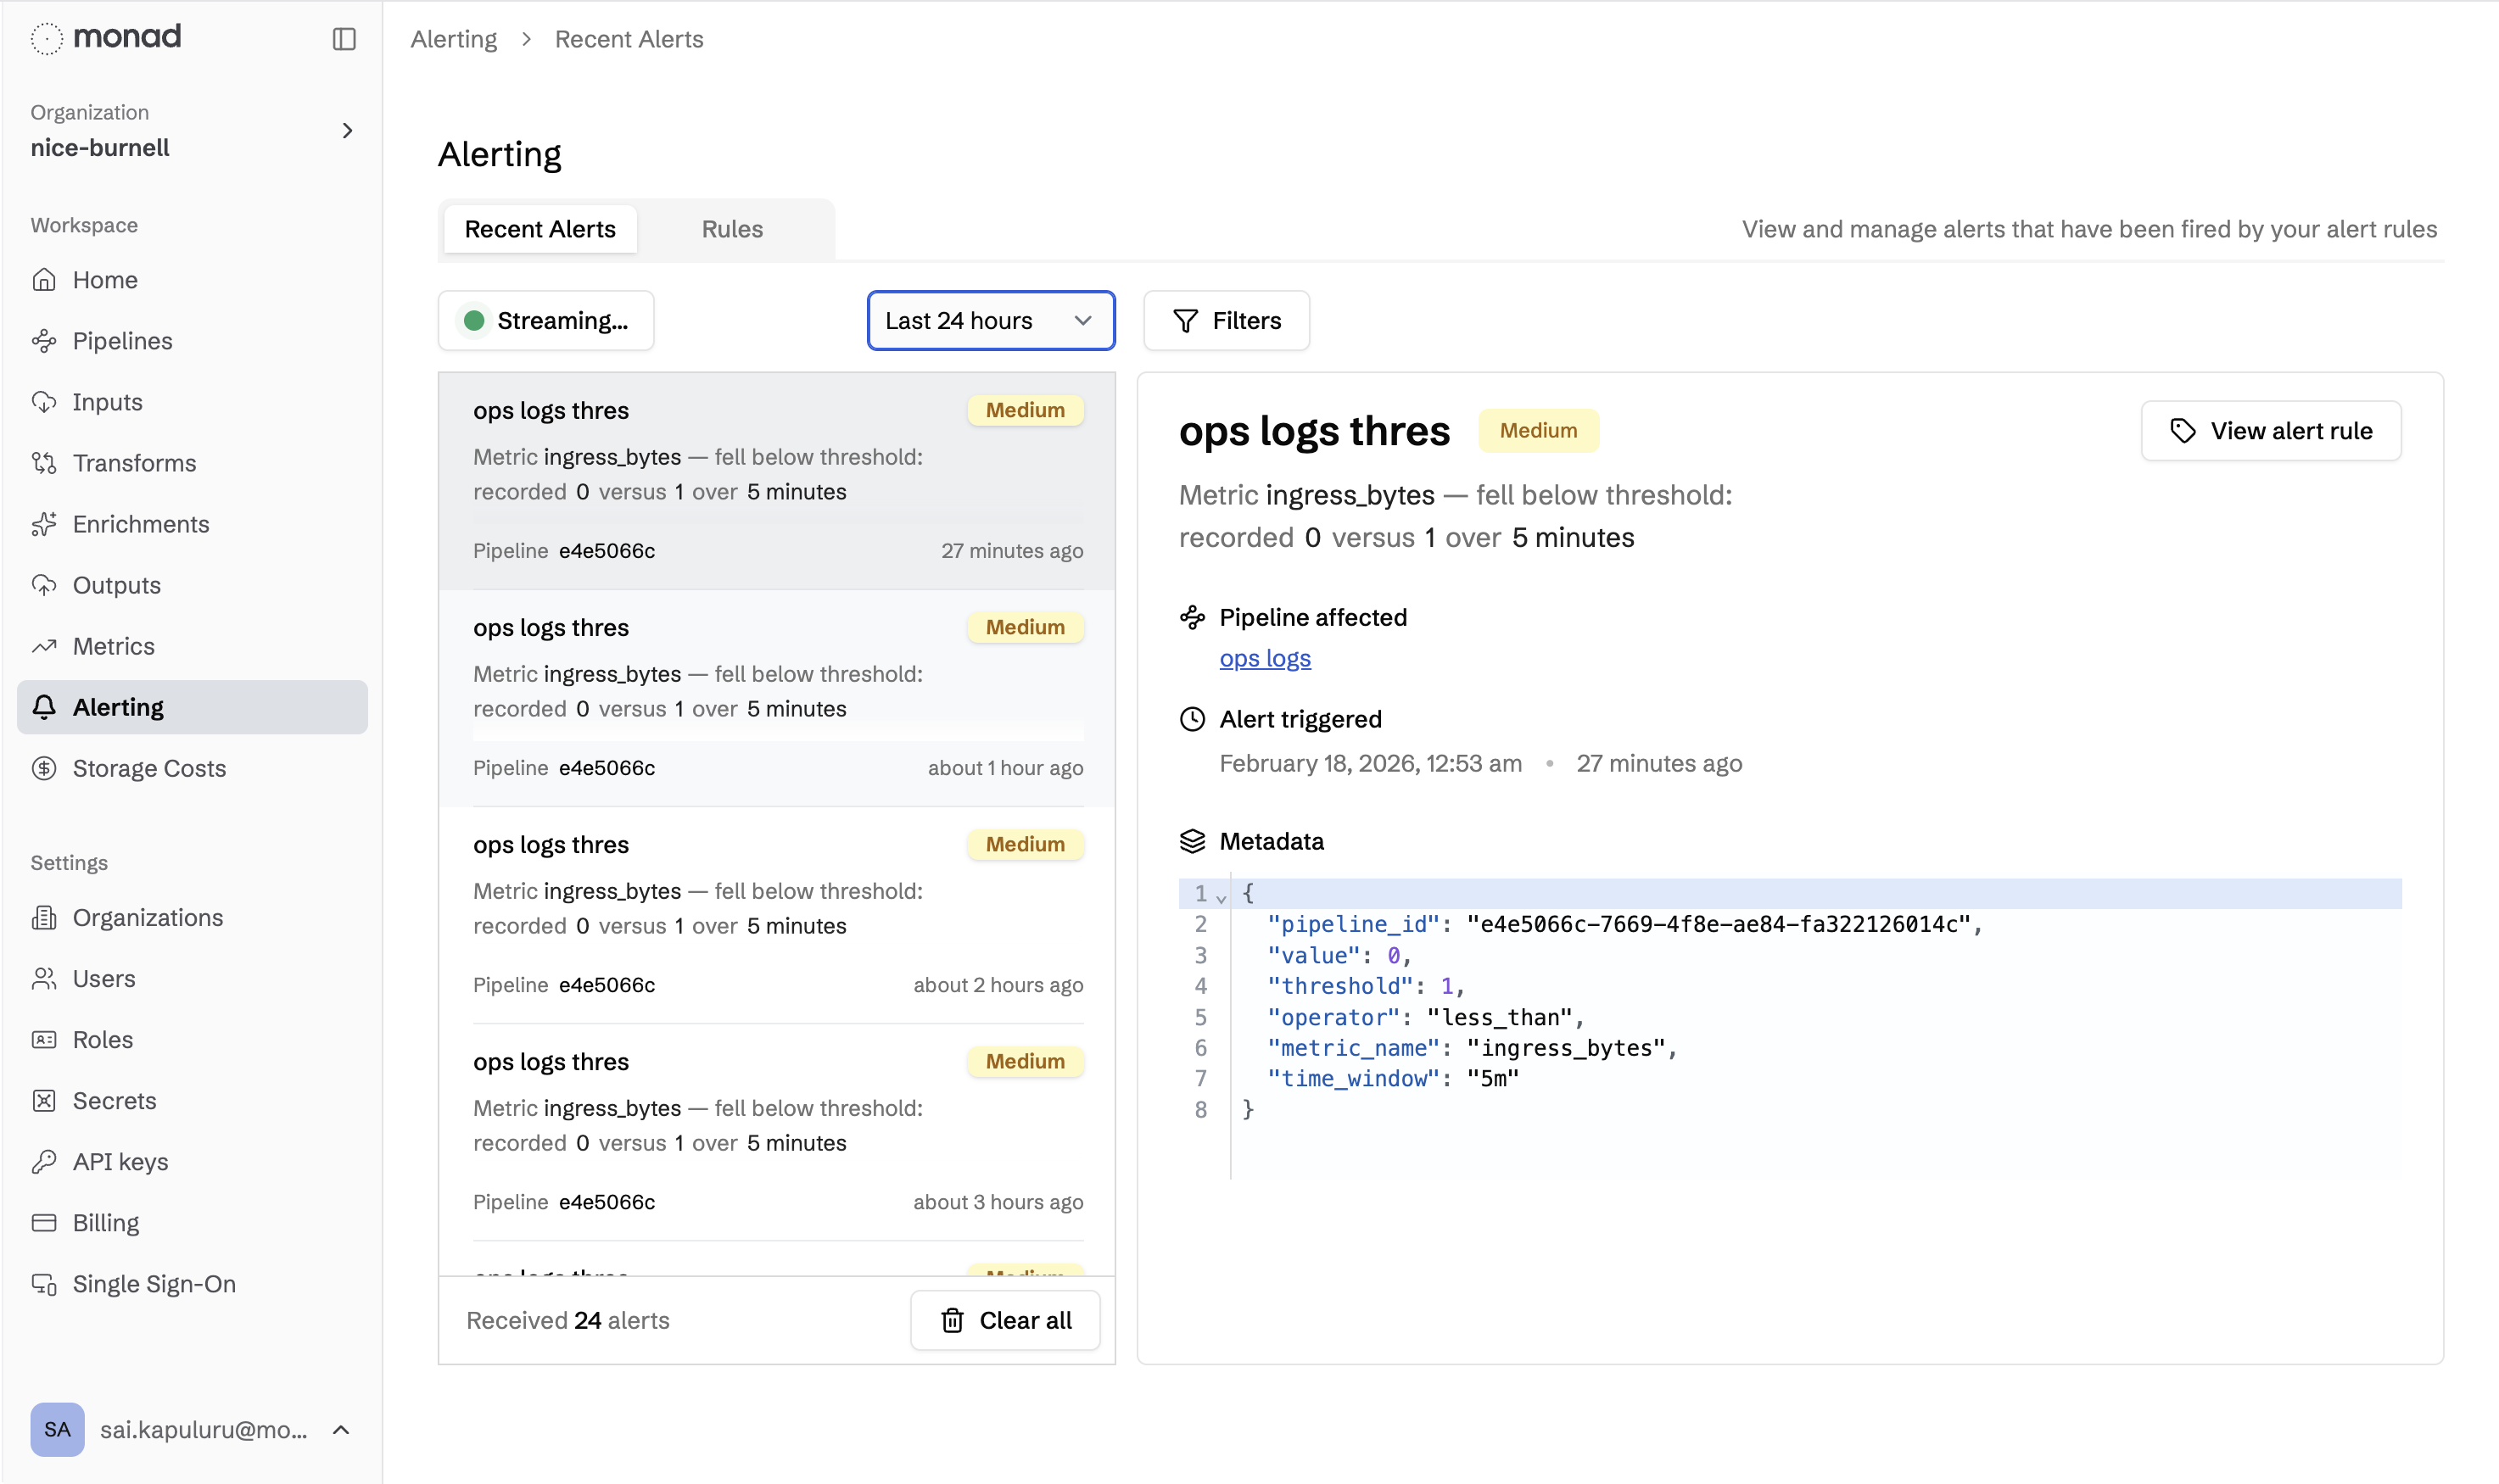
Use the event stream to:
- Confirm a new rule is working — after creating a rule, watch the stream to see whether expected alerts appear
- Triage active incidents — filter by severity or pipeline to focus on the most urgent events
- Spot patterns — repeated alerts from the same pipeline can indicate a systemic issue worth investigating in the pipeline's metrics view
End-to-End Example: Routing Alerts to Pagerduty
A common way to derive value from the alert service is to route alert events into a notification channel so your team is notified automatically. The general flow is:
- Create an alert rule on the Alert Rules configuration page (e.g., a Pipeline Status Alert watching for sustained
Erroringstatus) - Add a Monad Alerts input to a new or existing pipeline — this input streams every alert event generated by your rules as structured JSON
- Connect a Pagerduty (or other) output to the same pipeline and configure the destination channel
- Save and activate the pipeline — from this point on, every time the alert rule fires, the event flows through your pipeline and posts to Pagerduty
This pattern works with any Monad output, allowing you to send alerts to ticketing systems, SIEMs, data warehouses, or any other destination your organization already uses.